


Introduction to the Control Panel
This guide provides an overview of the control panel and its main features. The control panel allows you to manage your VPS, monitor its status, and perform common administrative tasks.
Dashboard Overview
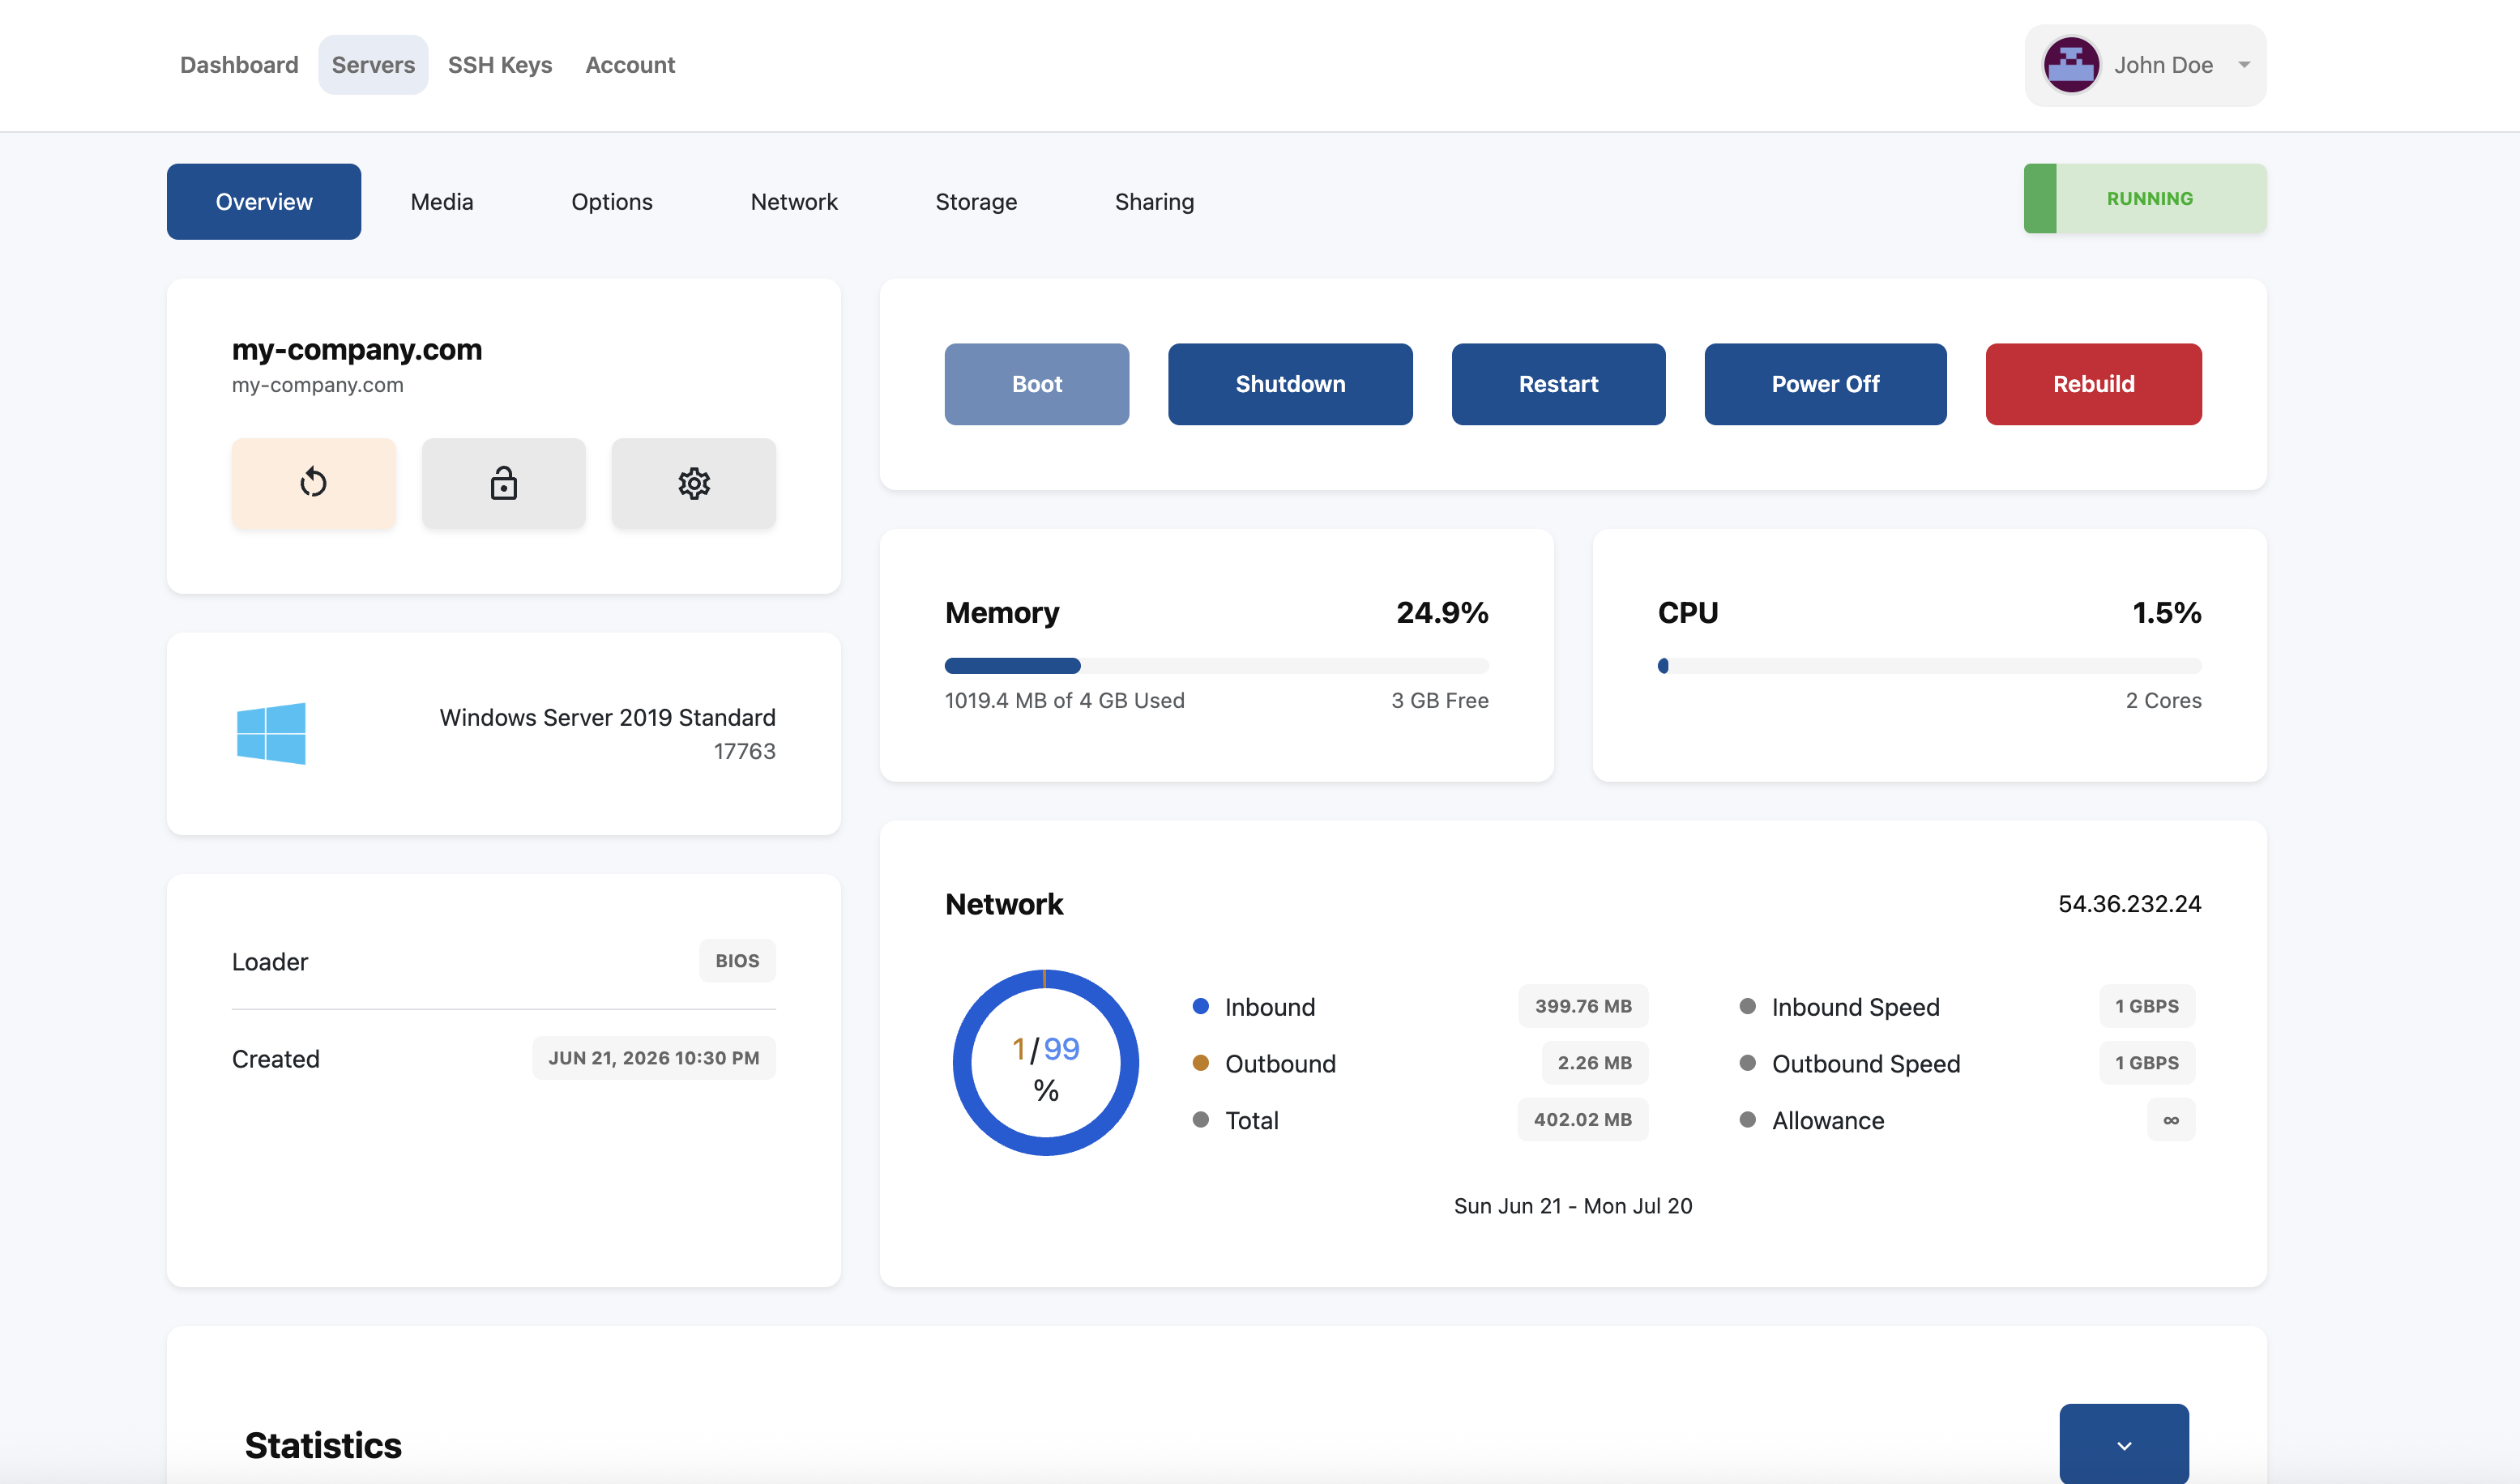
After logging in, you will be presented with the dashboard. This page provides a quick overview of your services and server information.
You may see information such as:
-
Server Status
-
CPU Usage
-
Memory Usage
-
Disk Usage
-
Network Statistics
-
Service Information
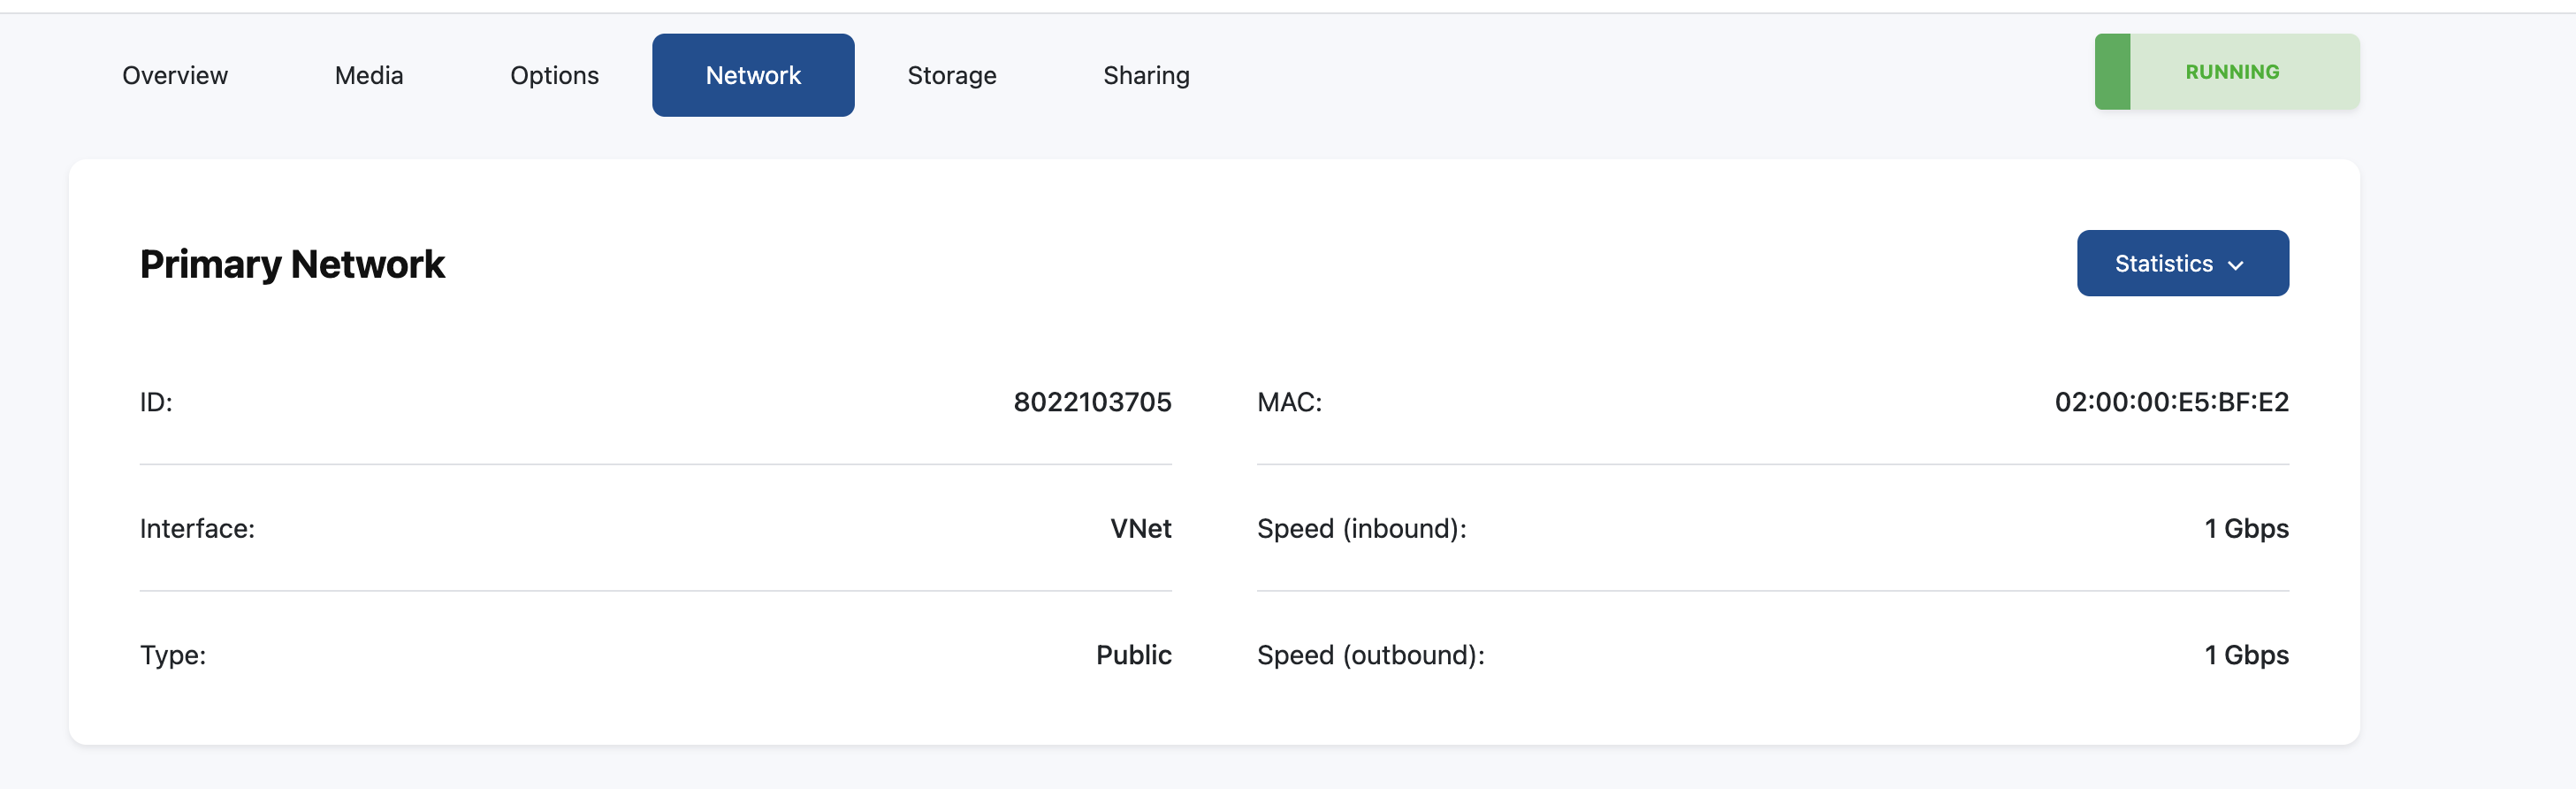
Viewing Your VPS Details
Select your VPS from the services list to access its management page.
From here, you can view:
-
IP Address
-
Hostname
-
Operating System
-
Resource Allocation
-
Server Status
Power Management
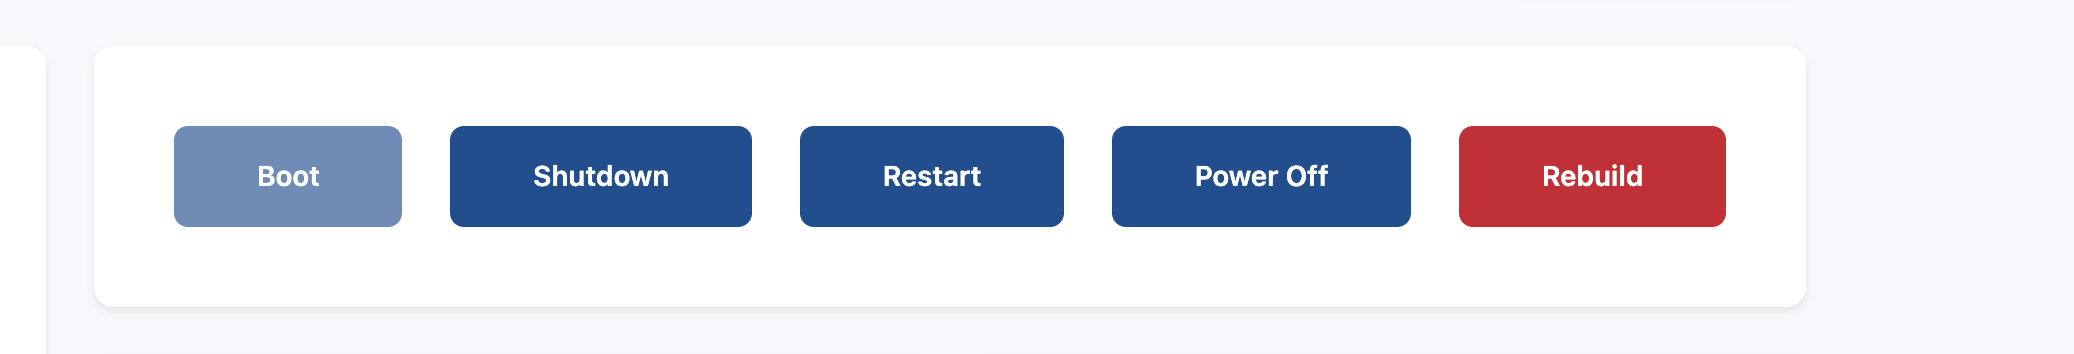
The control panel allows you to manage your server's power state.
Available actions may include:
-
Start
-
Stop
-
Reboot
-
Force Reboot
These options are useful when troubleshooting or performing maintenance.
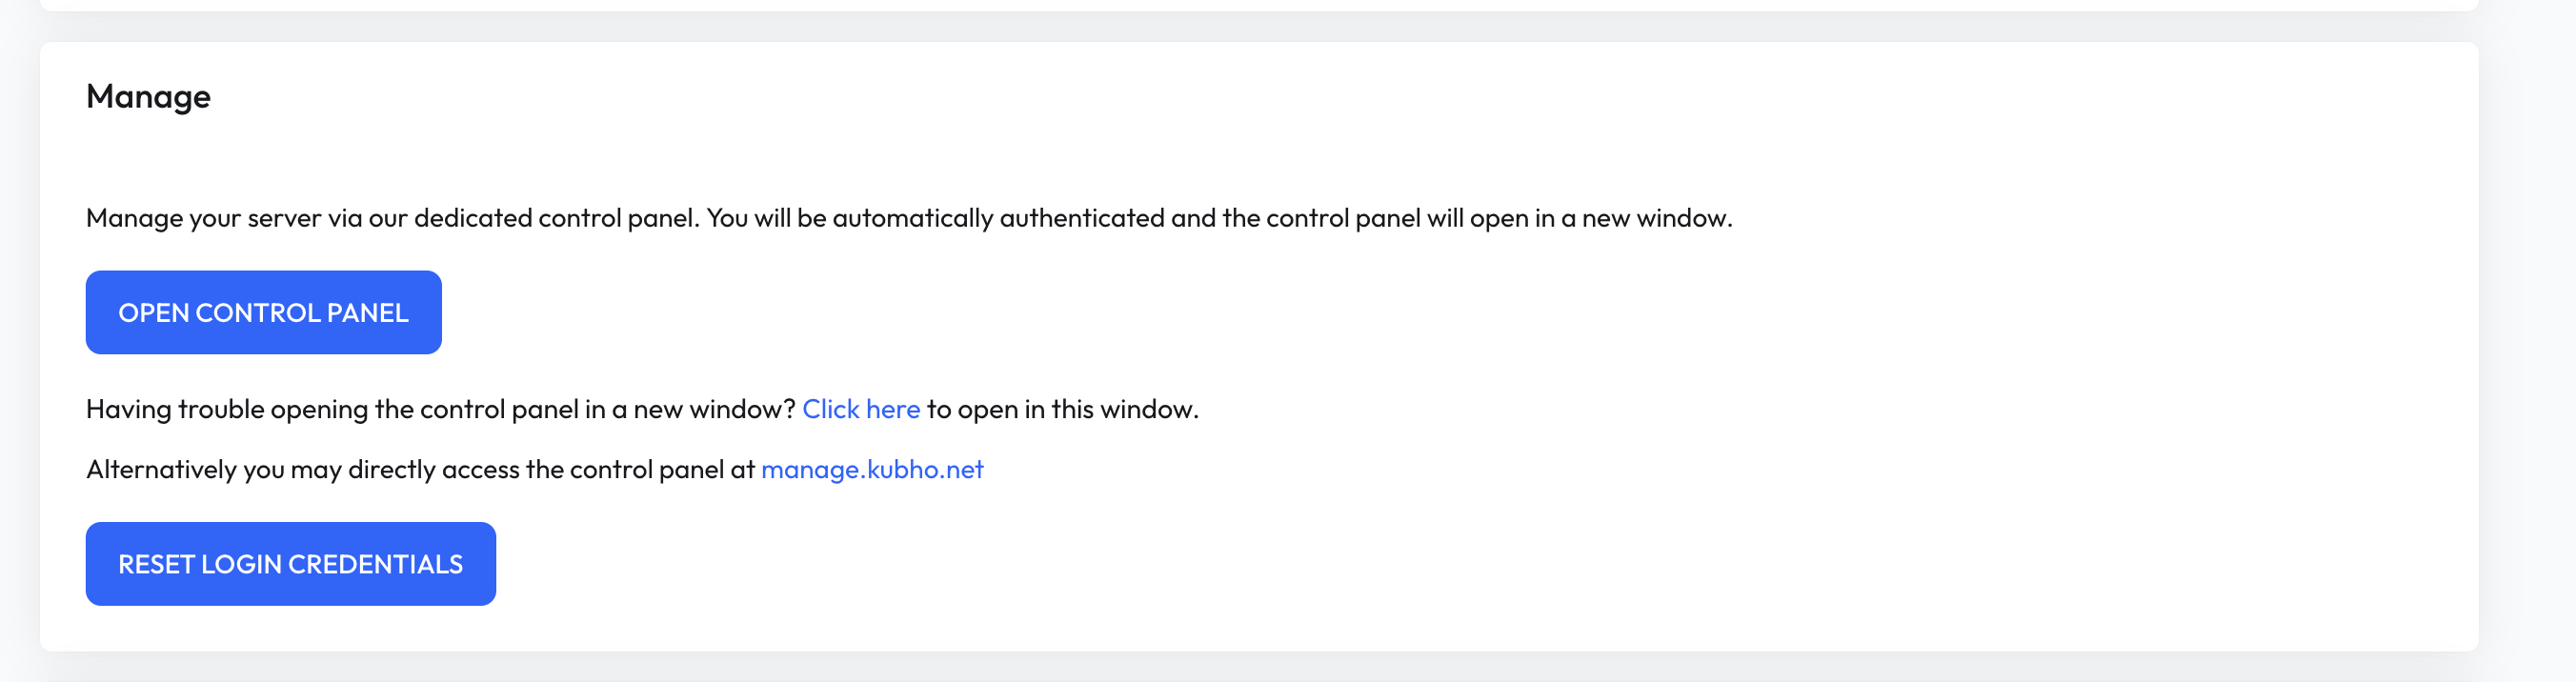
Accessing the Console
If you cannot connect using SSH or Remote Desktop, you can use the built-in console to access your server directly.
The console provides access even when network services are unavailable.
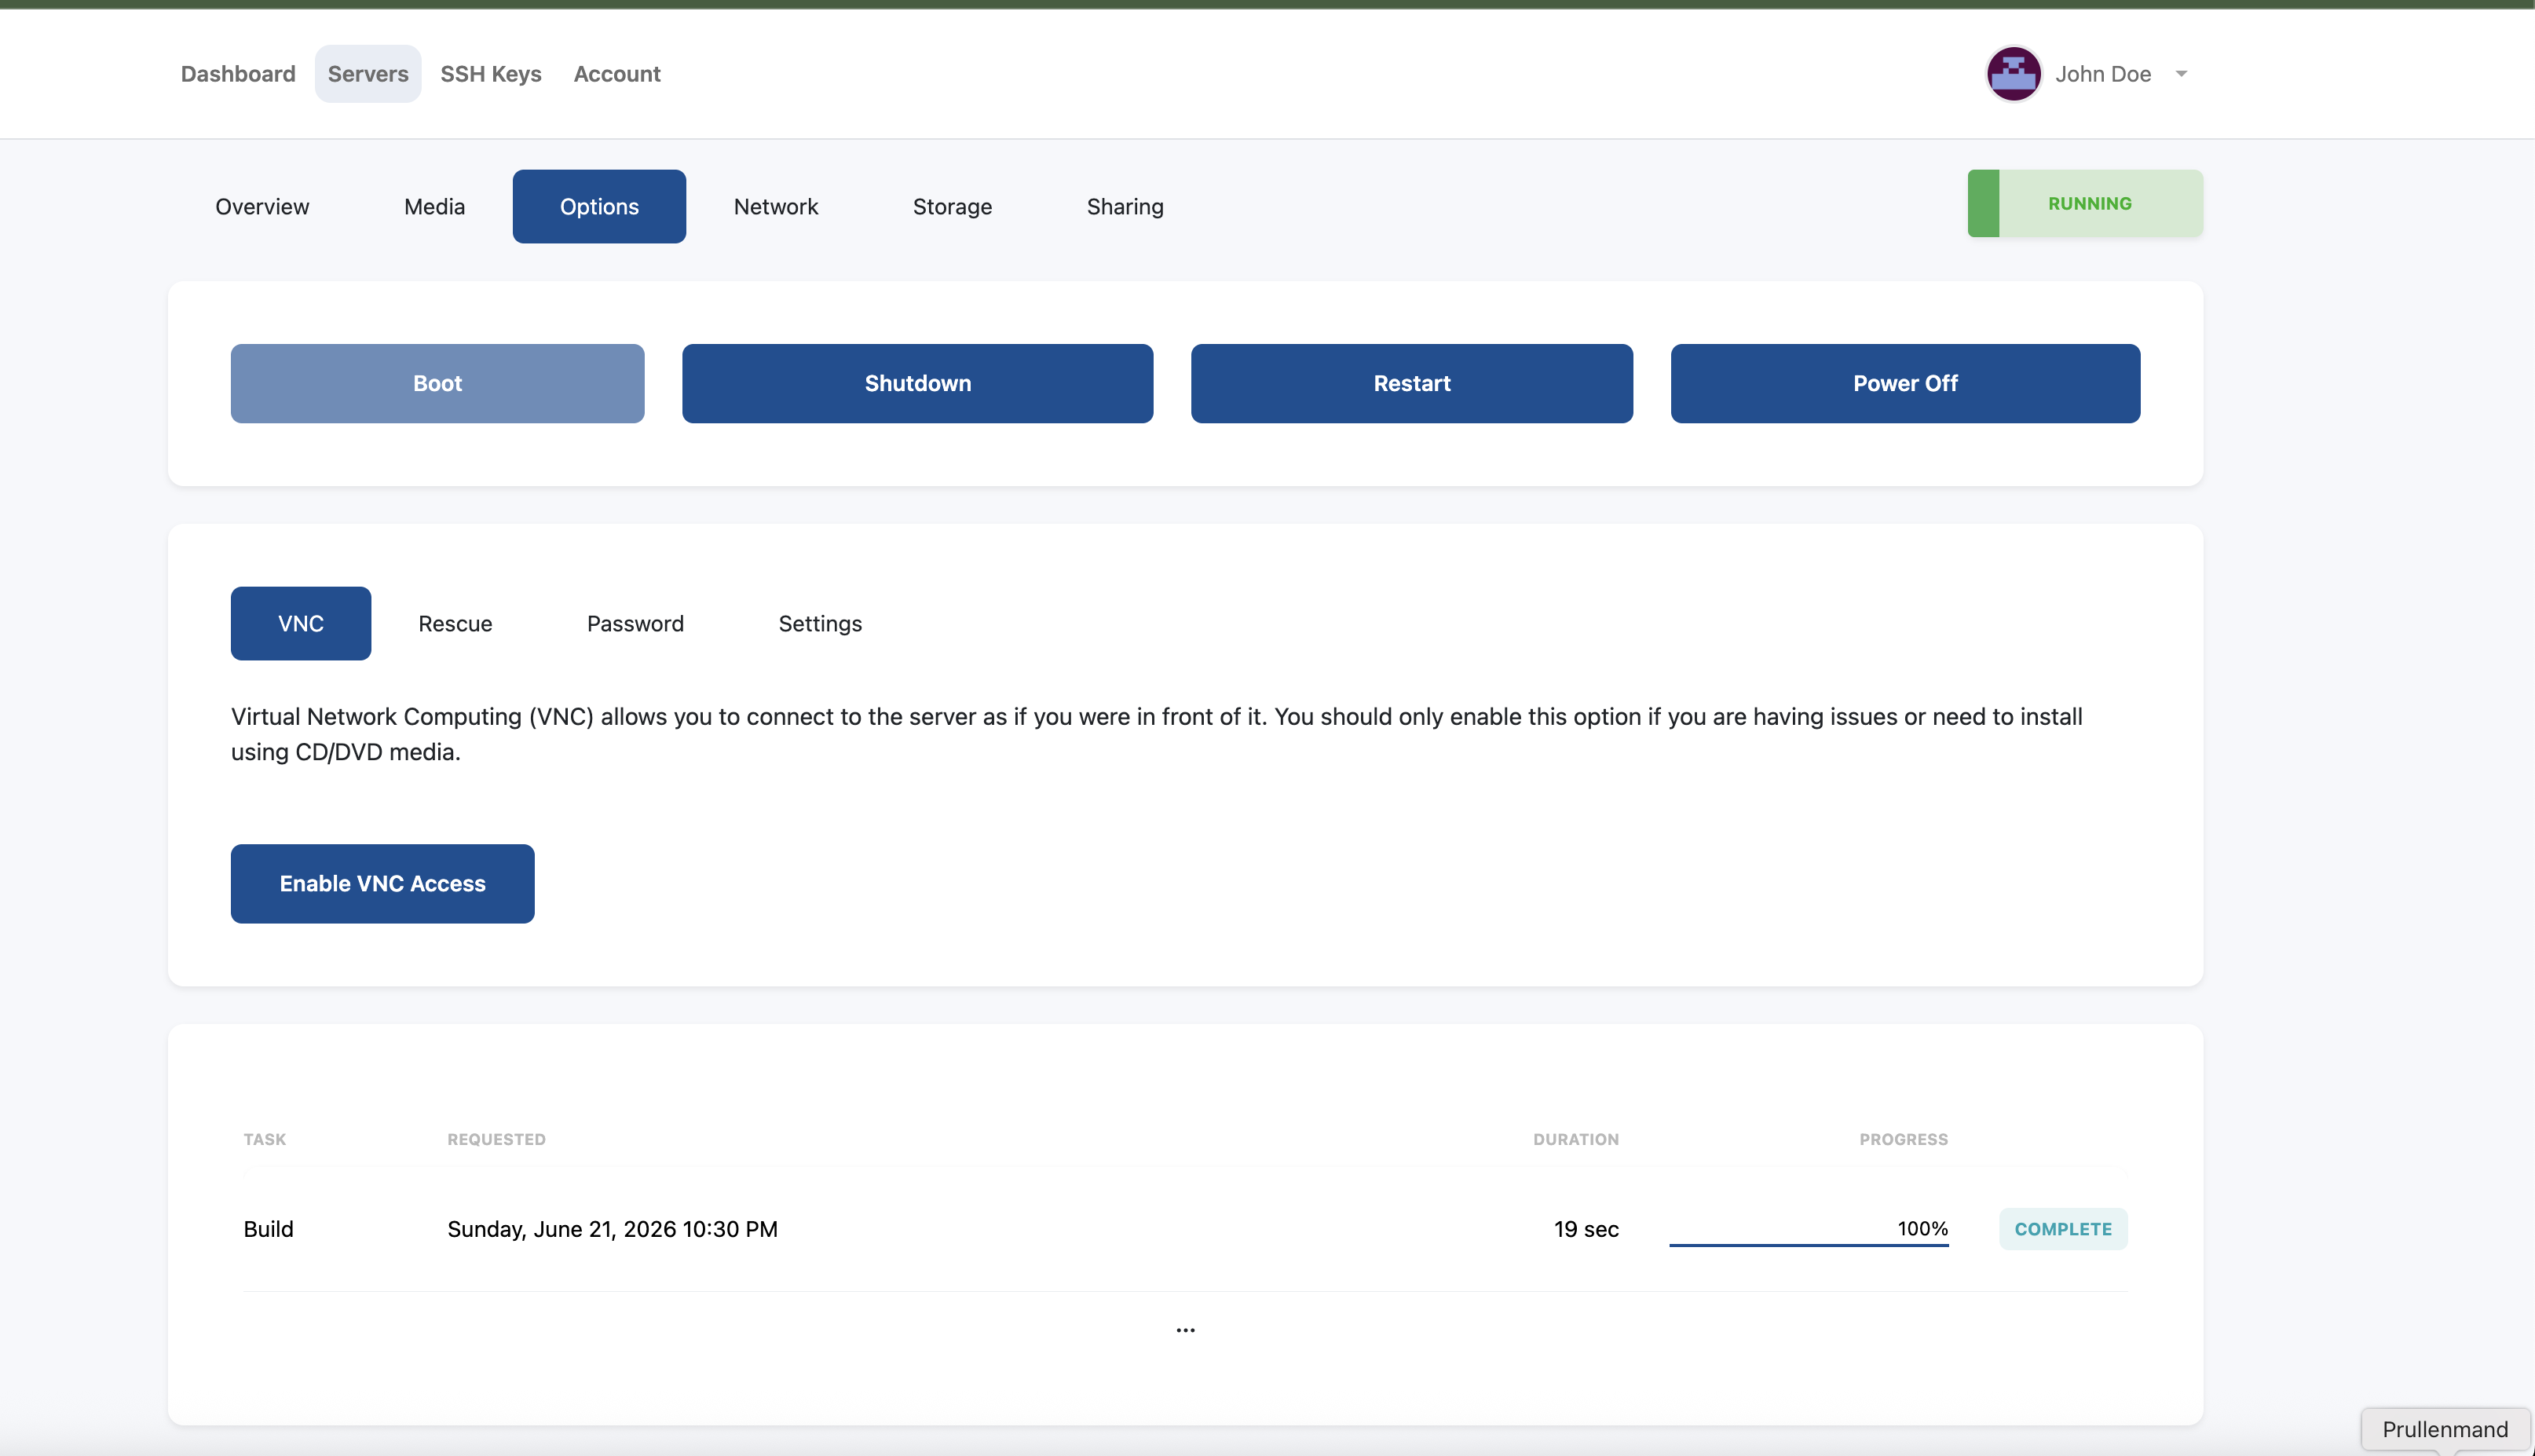
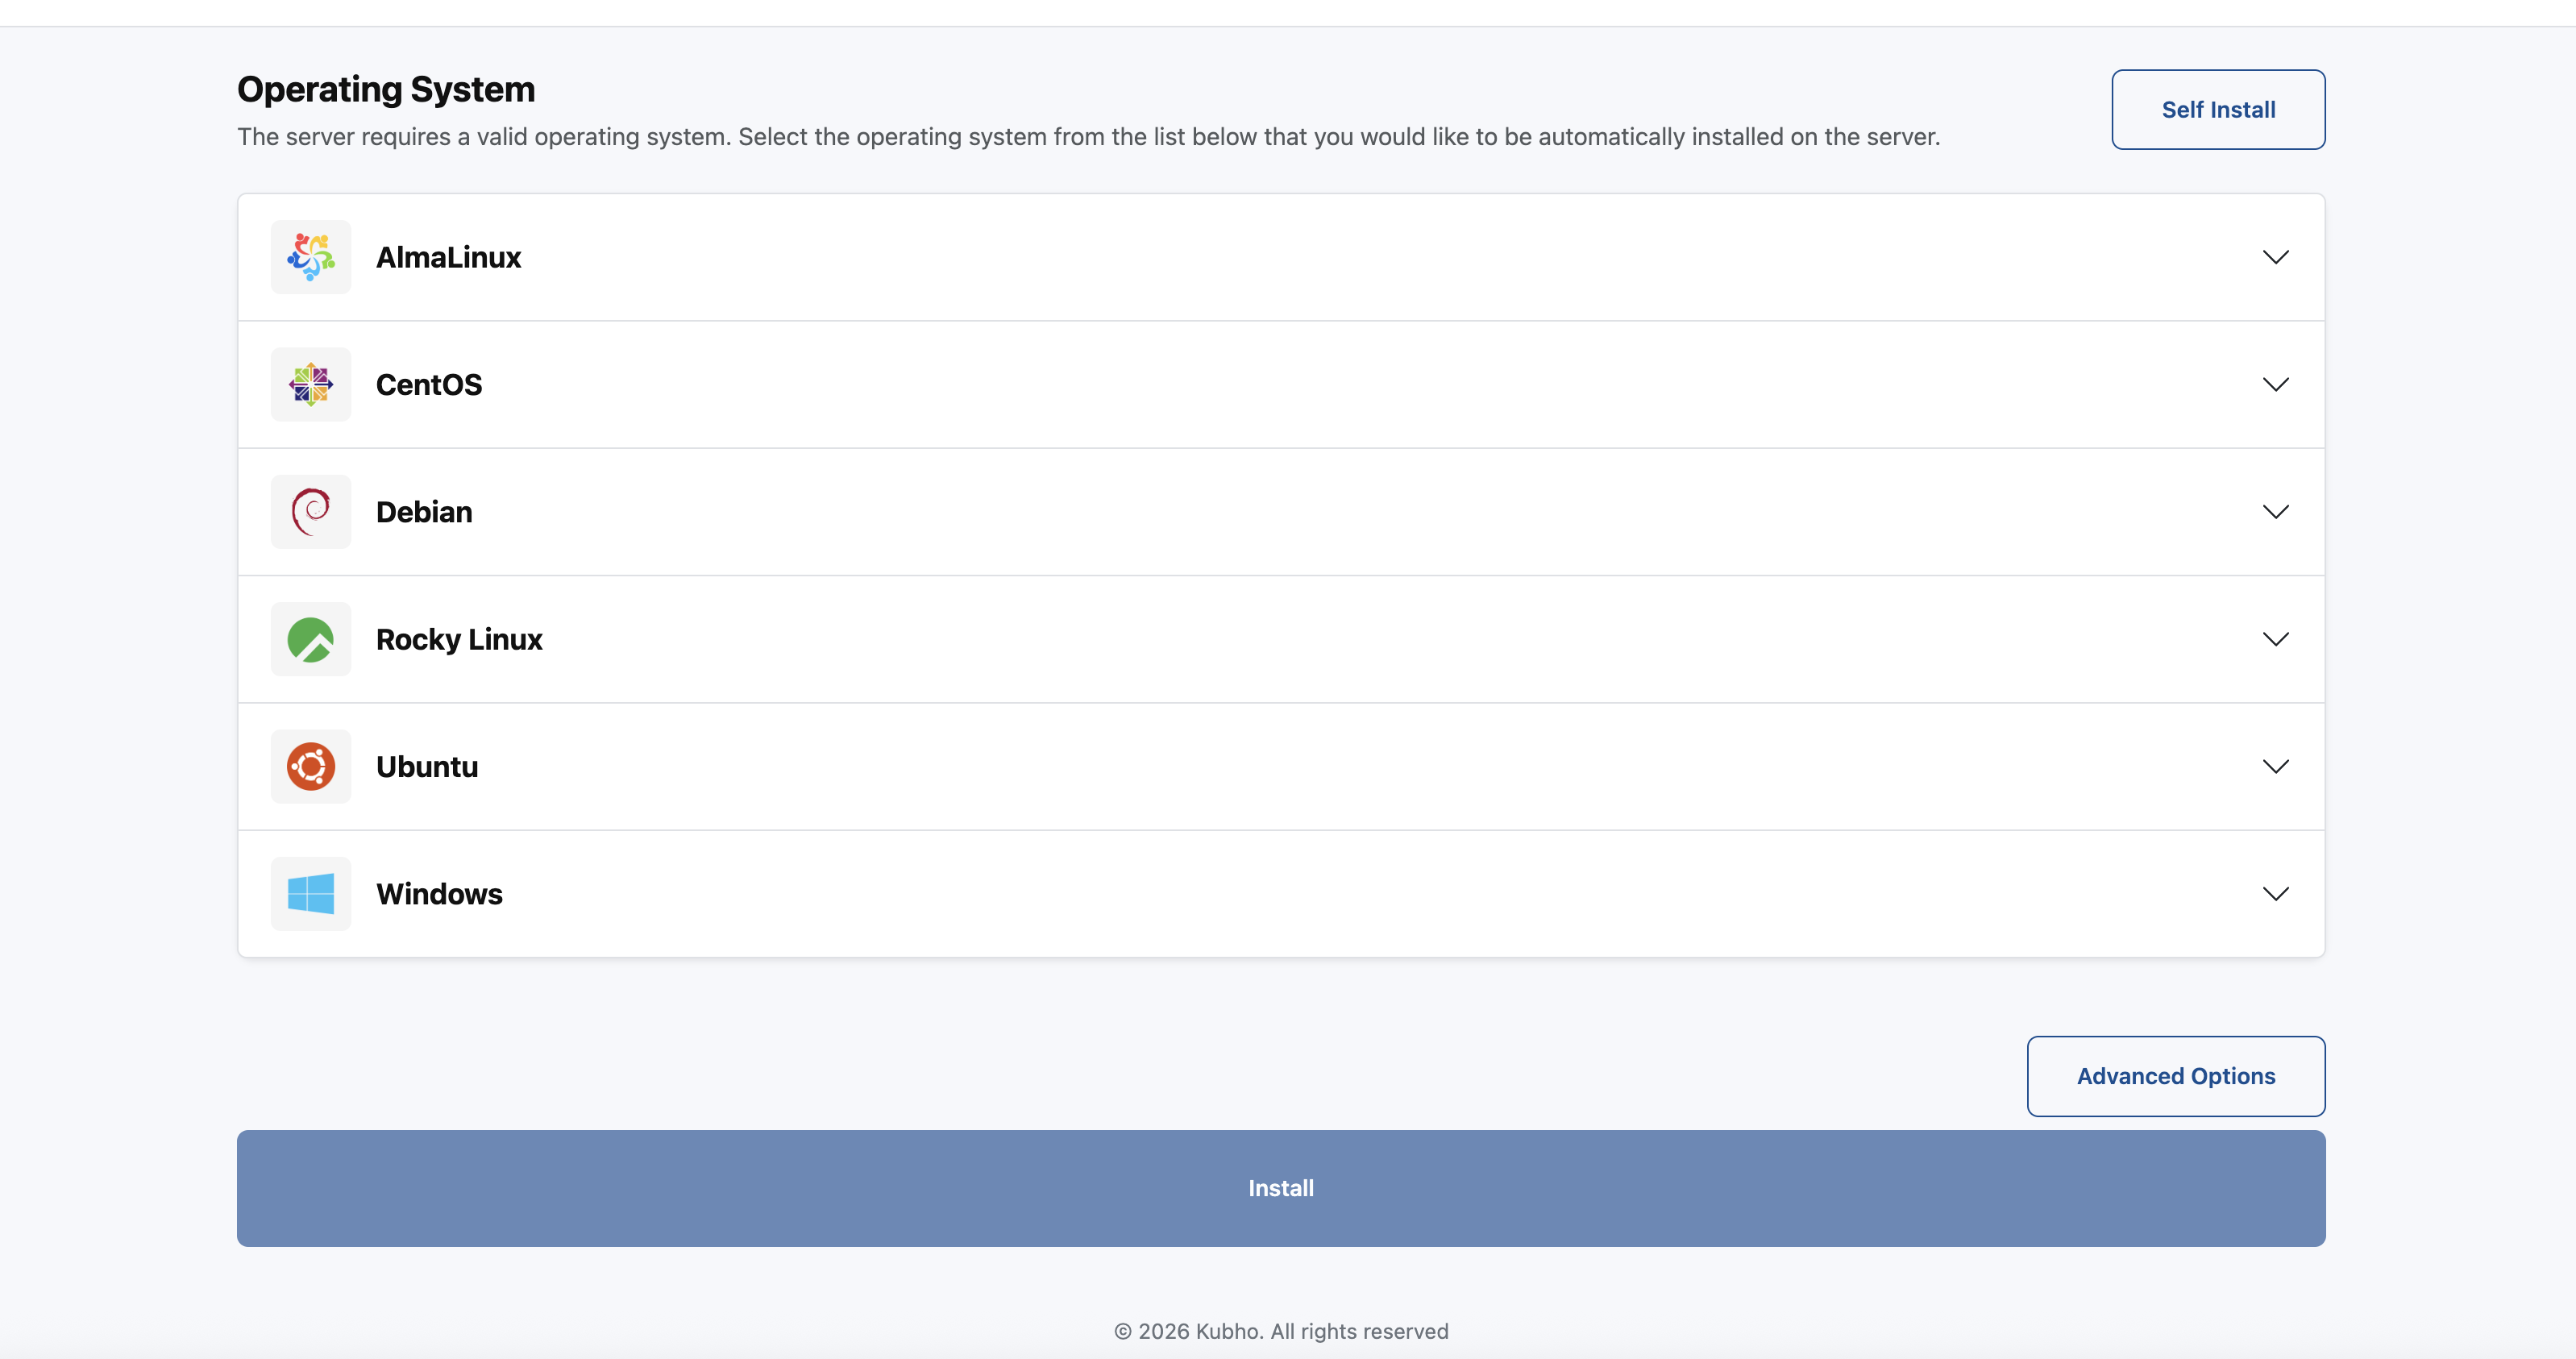
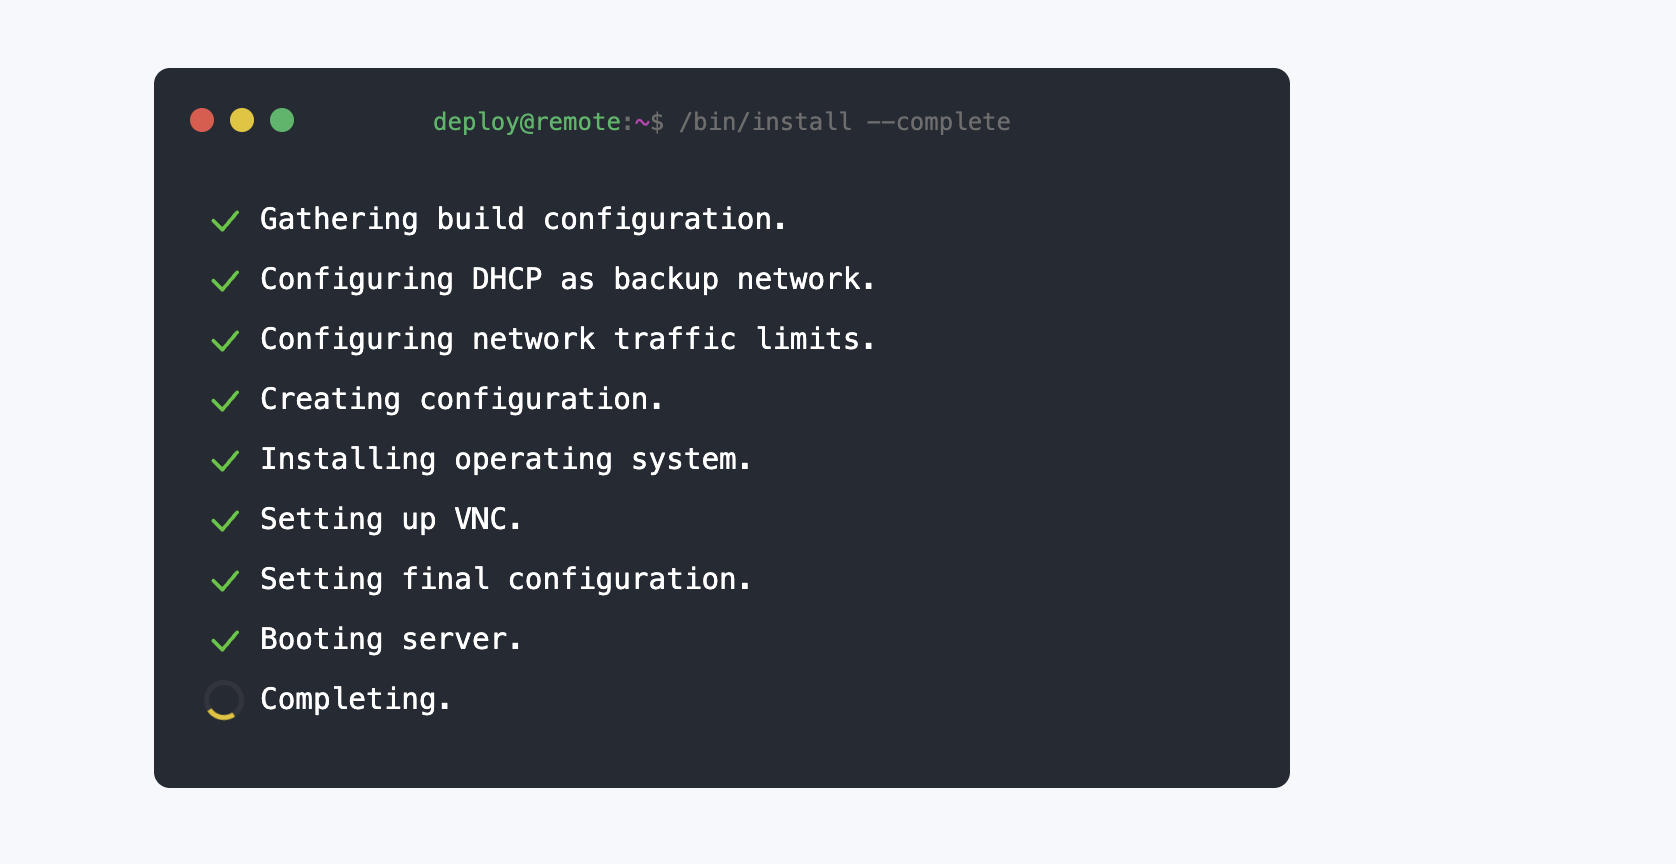
Operating System Management
Depending on your service, you may be able to reinstall your operating system directly from the control panel.
Before performing a reinstall, ensure that any important data has been backed up.
Monitoring Resources
The control panel includes basic resource monitoring tools to help you track server performance.
You can monitor:
-
CPU Usage
-
Memory Usage
-
Disk Usage
-
Network Traffic
Monitoring your resources can help identify performance issues and determine whether additional resources may be required.
Need Help?
If you have questions about any control panel feature or require assistance managing your server, please open a support ticket through the client portal.


